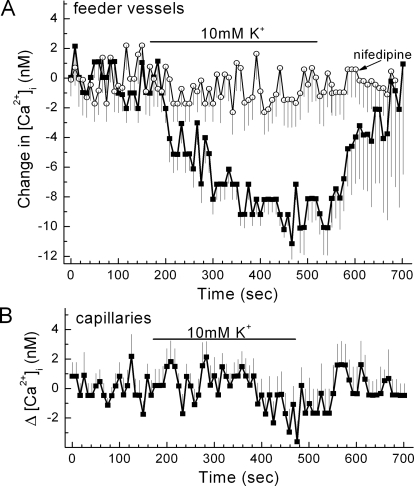
Figure 5.
Effect of a 10 mM K+-induced hyperpolarization on the intracellular calcium concentration of abluminal cells of feeder vessels and capillaries. (A) Plot of the mean change in intracellular calcium versus time for abluminal cells located on feeder vessels. Retinal microvessels were exposed to perfusates without (squares) or with (circles) 10 μM nifedipine. Initially, the perfusate was solution B (3 mM K+) plus or minus nifedipine. Solutions B and C had identical osmolarities and identical Na+ and Cl− concentrations. The bar shows when the perfusate was solution C (10 mM K+) plus or minus nifedipine. The number of monitored cells was 16 and 13 for the nifedipine-free and the nifedipine-containing groups, respectively. The decrease in calcium during exposure to solution C was significant (P < 0.0001), as was the inhibitory effect of nifedipine (P < 0.0001). (B) Plot of the mean change in intracellular calcium versus time for capillary pericytes (n = 19). Initially, the perfusate was solution B (3 mM K+); the bar shows when the perfusate was solution C (10 mM K+).

