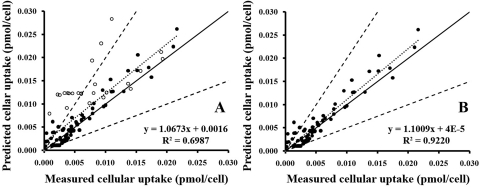
Fig. 6.
Assessing the performance of the cellular pharmacokinetic model. The predicted intracellular mass was plotted against the measured values at eight time points for four levels of CQ treatment with (or without) sucrose or bafilomycin A1. ——, the unity line; – – –, factor of 2 on both sides of the unity line; · · · · ·, the best fit with the equation displayed. ●, data from 25, 50, and 100 μM CQ treatments; ○, data from 200 μM CQ treatments. A, analysis of measurements from 25, 50, 100, and 200 μM CQ treatments. B, analysis of measurements from 25, 50, and 100 μM CQ treatments.

