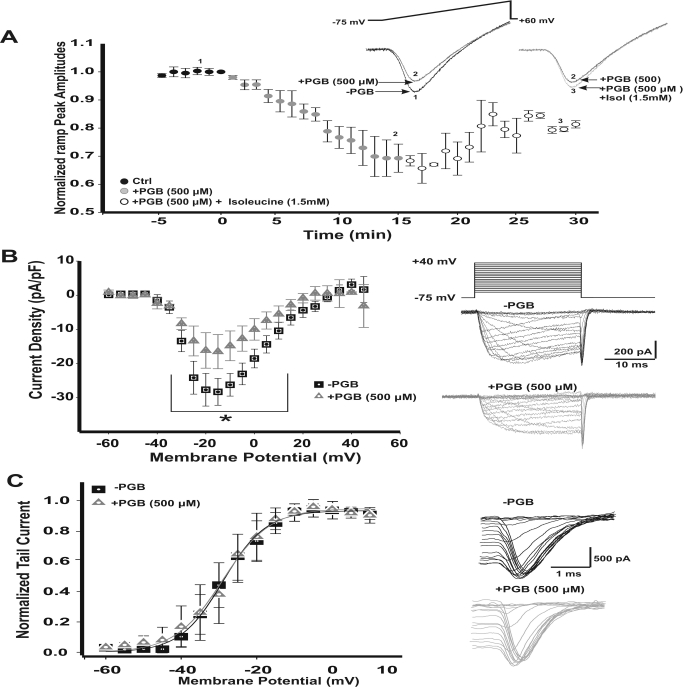
Fig. 3.
Acute reduction of presynaptic calcium currents (IpCa) by PGB. A, peak current amplitudes observed for 50-ms depolarizing voltage ramps either after bath perfusion with 500 μM PGB (filled gray circles, n = 7) or with the combination of PGB + 1.5 mM isoleucine (Isol; open gray circles, n = 3). PGB reduced calcium currents (IpCa) by 30%, whereas in the presence of PGB + isoleucine, IpCa recovered 10% above control amplitudes. Stimulus ramp protocols with their representative IpCa are shown in the right inset. Numbers from 1 to 3 indicate the specific time points of the representative traces illustrated. B, current density-voltage relationships for IpCa before (−PGB) and after a 15-min bath perfusion with PGB (+PGB). The IpCa started activating at −35 mV with an apparent reversal potential at +40 mV. Peak inward current density was reached at −15 mV with mean values of −28.3 ± 3.9 pA/pF for −PGB and −16.5 ± 5.0 pA/pF for +PGB (*, repeated measures ANOVA, F2, 214 = 19.594, p < 0.001, Student-Newman-Keuls post hoc test, t < 0.01). Stimulus waveform for the I-V protocol (holding potential −75 mV, voltage square pulses ranging from −60 to +50 mV, 5-mV steps, 20-ms duration) is shown together with representative recordings of IpCa -PGB (top, black) and +PGB (bottom, gray). Current amplitudes are the mean during the last 5 ms of the recordings for each potential. C, IpCa activation curves, obtained from tail currents (see representative tails currents shown in right panels). Activation curves were fitted using a Boltzmann equation. IpCa activated at the same voltages at both conditions. Half-activation voltages (V1/2) were 28.9 ± 0.4 mV for −PGB (n = 11) and 28.3 ± 0.5 mV for +PGB (n = 11, Student's t test, p > 0.05). Slopes (k) were 5.7 ± 0.4 and 5.4 ± 0.4 mV (Student's t test, p > 0.05) for −PGB and +PGB, respectively. Values are presented as means ± S.E.M.

