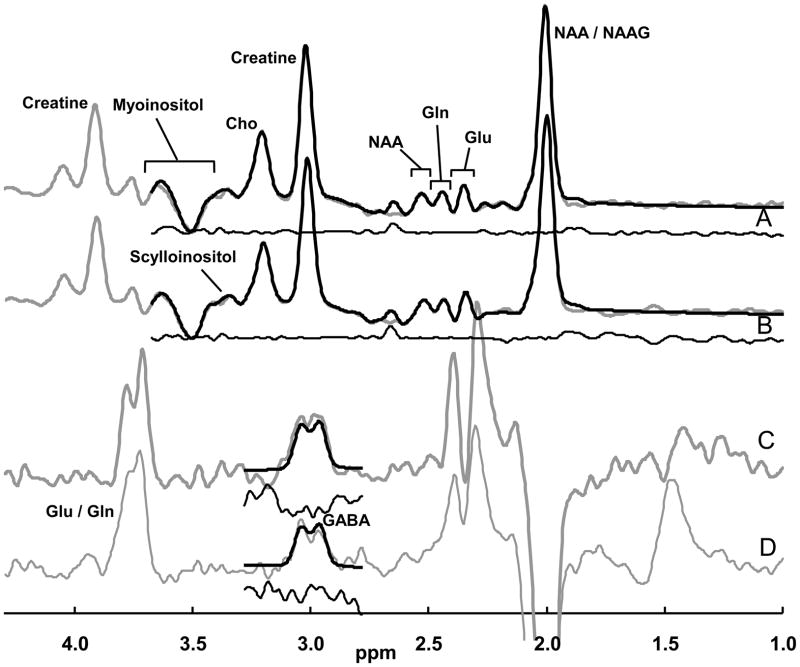
Figure 2. Representative MR spectra from a single subject.
The data are shown with gray lines, the spectral fits with black lines superimposed on the data, and the residuals are shown immediately beneath in black. (A) Pre-treatment subspectrum obtained without the editing pulse, yielding glutamate, glutamine and metabolites other than GABA. (B) Post-treatment subspectrum. (C) Pre-treatment J-edited difference spectrum, yielding GABA levels. (D) Post-treatment J-edited difference spectrum. The subspectra were fitted only to just beyond the myoinositol resonances, and the difference spectra were fitted only around the GABA resonance.

