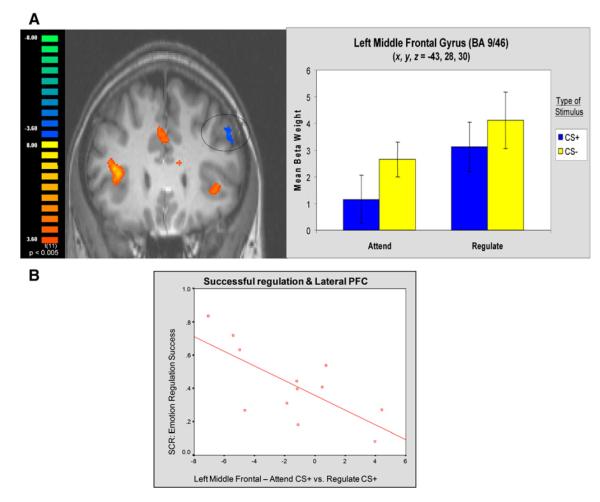
Figure 2. BOLD Signals in dlPFC during Regulation.
(A) BOLD responses in dlPFC (in blue) are higher during Regulate compared to Attend CS+ trials.
(B) Correlation between physiological measure of regulation success and BOLD levels in dlPFC reflecting differential response of Attend and Regulate CS+ trials.

