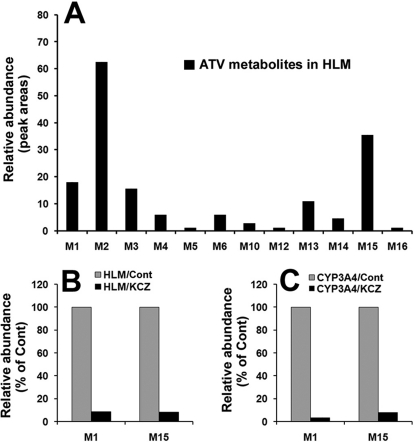
Fig. 7.
ATV metabolism in HLM and the role of CYP3A in ATV metabolism. Duplicate incubations were conducted in 1× PBS (pH 7.4) containing ATV (50 μM), NADPH (1.0 mM), HLM (0.5 g of protein/l), or CYP3A4 (10 nM). KCZ (10 μM) was used in the inhibitory test. A, relative abundance of ATV metabolites generated from HLM. B, effects of KCZ (10 μM) on the formations of M1 and M15 in the incubation with HLM. C, effects of KCZ (10 μM) on the formations of M1 and M15 in the incubation with cDNA-expressed CYP3A4. The data are expressed as means.

