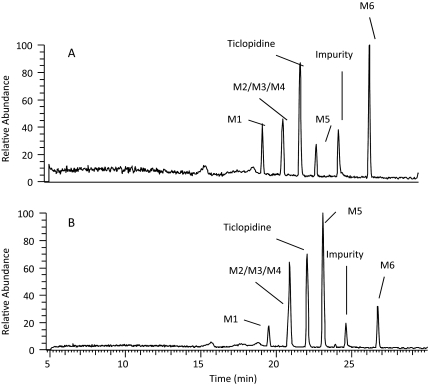
Fig. 2.
HPLC-MS chromatograms of mixtures after incubation of ticlopidine (10 μM) with NADPH supplemented CYP2B6 (A) and CYP2B4 (B) for 60 min. The metabolite peaks are represented as M1–M6 and the structures are shown in Fig. 5. The preparation and the experimental conditions of sample preparation are described under Materials and Methods. All the incubations contained 100 pmol of reconstituted P450.

