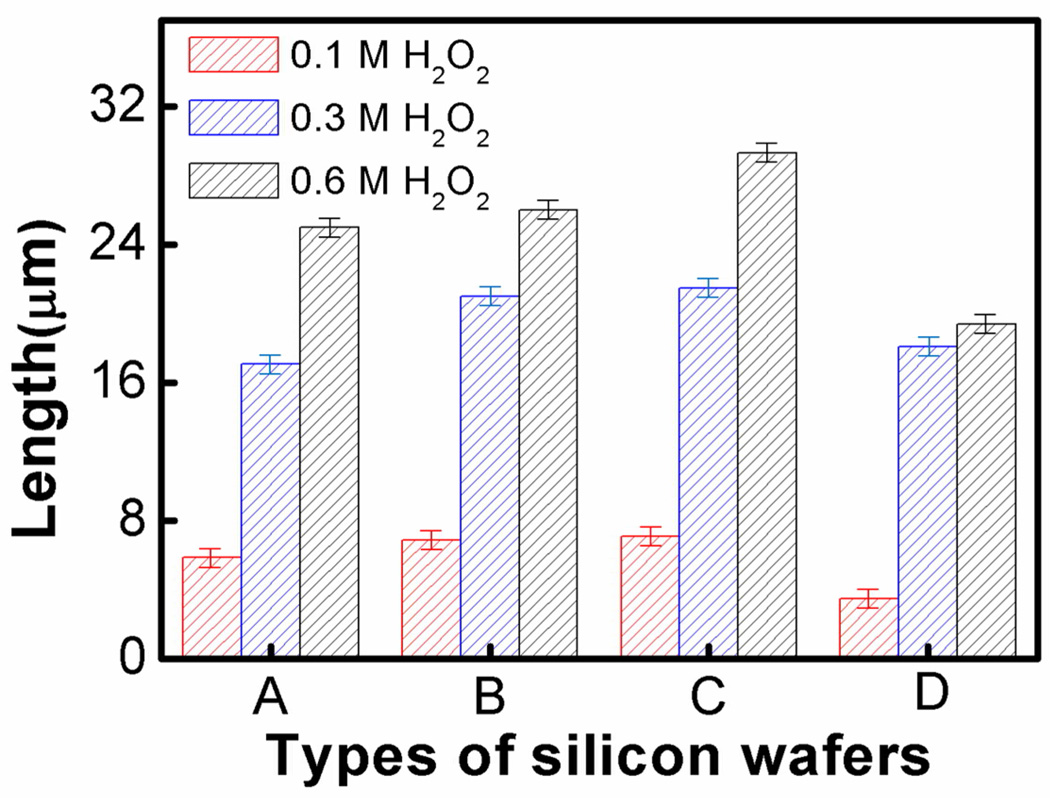
Figure 3.
Length evolution of silicon nanowires from four types of starting wafers with increasing H2O2 concentration. (A) Silicon nanowires from 1–5 Ω·cm silicon wafer. (B) Silicon nanowires from 0.3–0.8 Ω·cm silicon wafer (C) Silicon nanowires from 0.008–0.016 Ω·cm silicon wafer (D) Silicon nanowires from 0.001–0.002 Ω·cm silicon wafer.

