
Fig. (7). Quantitative characterization of cell shape descriptors and morphologic expression of GFP-farnesylation using cell morphometric descriptors.
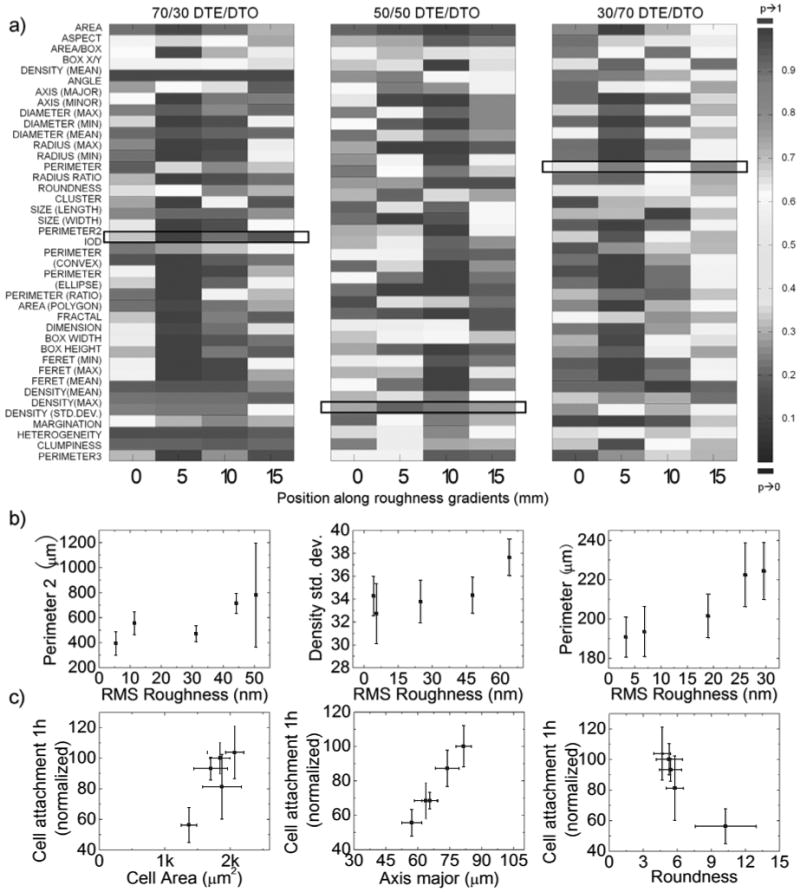
a*) A ‘heatmap’ demonstrates the difference along roughness gradients of different pDTEc/pDTOc compositions. Cell population descriptors were determined for cells (15-30 cells per position) cultured at different locations along individual roughness gradient positions (0, 5, 10 and 15 mm) within compositional blends. An ANOVA with post-hoc Tukey's HSD was utilized to determine differences in mean values of cell population descriptors as compared to the mean values of population descriptors on smooth surfaces of the same composition. The “heat map” representation identifies the statistical differences (P-value) between descriptor values comparing positions of increasing roughness and smooth positions utilizing a color-based keying system. A strong statistical difference in descriptor value (ANOVA p value approaching 0) is represented by blue, while no statistical difference (p value approaching 1) by red, an intermediate color between dark blue and red indicates moderate statistical difference (p value between 0 and 1) The heat map does not compare the mean values of descriptors between different levels of roughness within the same compositions, nor do the color bars correlate to the direction of the difference.; b*) Identified descriptors that are sensitive to changes in surface roughness within polymer chemistries. Cell perimeter2 (another method of calculating perimeter of a cell), density (GFP-F fluorescent intensity normalized to cell area) standard deviation and perimeter were identified as descriptors that were sensitive to surface roughness of 70/30, 50/50 and 30/70 pDTEc/pDTOc respectively. c*) Identified descriptors that are well correlated to short term cell attachment. The 1h cell attachment was intercorrelated to cell area, axis major and roundness of 70/30, 50/50 and 30/70 pDTEc/pDTOc respectively. *1) represents polymer blends with 70/30 pDTEc/pDTOc; *2) represents polymer blends with 50/50 pDTEc/pDTOc; *3) represents polymer blends with 30/70 pDTEc/pDTOc.