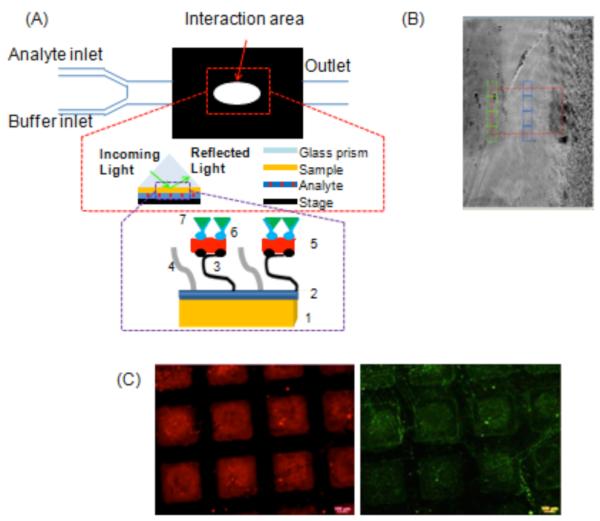
Figure 4.

SPREE analysis set-up and fluorescence microscopy. (A) SPREE imaging was utilized to analyze biomolecular interactions with the CVD surface. Experimental set-up consisted of an inlet for buffer and analyte flow and the fluids were delivered by syringe pumps to the interaction area. The second inset is a schematic of the sample architecture with each component represented numerically as follows: 1. Au coated SPREE slide 2. PPXCOC2F5 3. Biotin hydrazide long chain 4. 10k PEG hydrazide 5. Streptavidin TRITC 6. Biotinylated Fibrinogen Antibody 7. Fibrinogen FITC (B) Prior to analysis, portions of the sample patterned with biotin hydrazide and unpatterned areas reacted with PEG hydrazide were selected for data collection (C) Secondary confirmation of protein binding via fluorescence microscopy. The left image is the rhodamine channel which indicates the binding of streptavidin TRITC and the right image is the fluorescein channel which indicates binding of fibrinogen FITC.
