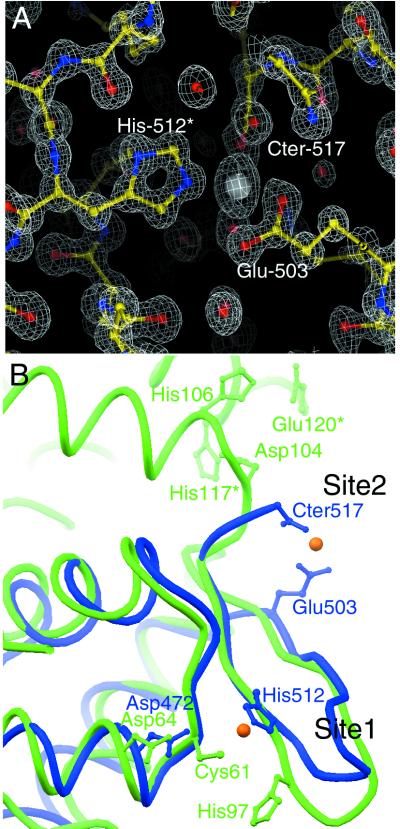
Figure 3.
(A) 2|Fobserved| − |Fcalculated| difference Fourier synthesis calculated at 1.02-Å resolution and contoured at 2.2σ. Protein atoms, Zn2+ ion, and water molecules are displayed with ball-and-stick representations, color-coded by atom type. Two residues, the C terminus, and one water molecule are shown coordinating the bound Zn2+ ion (Glu-503, His-512*, Cter-517) are indicated. Asterisk indicates residue from a neighboring molecule. (B) α-Carbon superposition of hRAP74cc (blue) and SmtB (green) showing selected side chains that contribute to Zn2+ ion binding. Two orange spheres show the crystallographically identical positions of Zn2+ ion.

