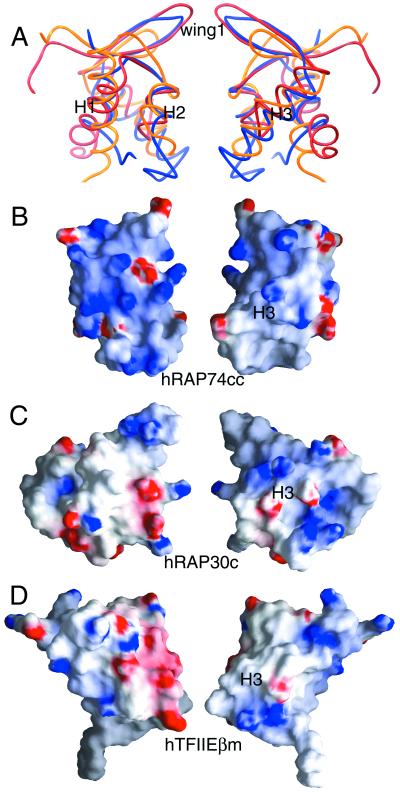
Figure 4.
(A) α-Carbon superpositions of hRAP74cc (blue) with hRAP30c (red) and hTFIIEβm (yellow). (B–D) Surface electrostatic properties of winged-helix proteins found within the pol II PIC calculated with grasp (46). Red and blue denote regions of negative and positive electrostatic potential, respectively (red < −15kBT, blue > +15kBT, where kB is the Boltzmann constant and T is temperature in Kelvin). Right and left images are related by 180° rotations about the vertical.

