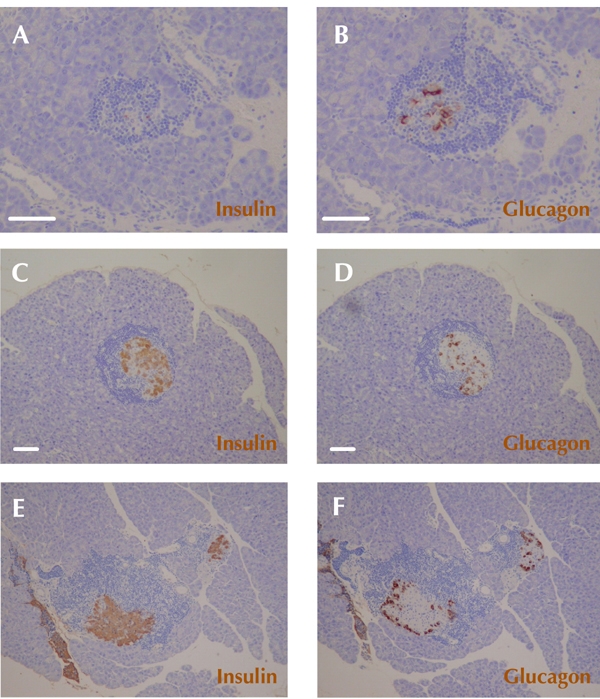
Figure 3. Alpha-cells scattered within residual islets in the group of CXCL10 DNA-treated mice with reversal of hyperglycemia.

Immunohistochemical staining of insulin (A, C, E) and glucagon (B, D, F) was performed. A and B: Representative insulitis lesions in established diabetic NOD mice in the group of control DNA mice. C and D: Representative insulitis lesions in the group of CXCL10 DNA-treated mice with reversal of hyperglycemia 8 to 10 weeks after first DNA vaccination. Glucagon-positive cells (α-cells) are scattered within remaining islets (D). E and F: Representative typical distribution patterns of α-cells and β-cells in insulitis lesions of a new-onset diabetic NOD mice. Scale bars: 80 μm.
