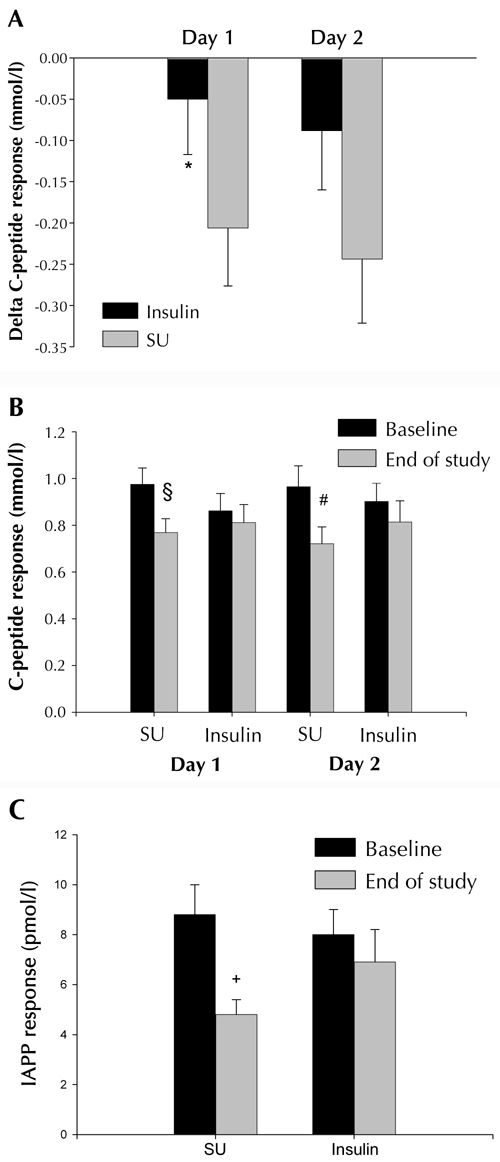
Figure 2.

Delta C-peptide responses to glucagon (A) baseline vs. end-of-study, between the insulin-treated group (Insulin, n = 16), and the glibenclamide-treated group (SU, n = 18). Data are mean ± SEM. * p < 0.05 vs. SU. C-peptide (B) and IAPP (C) responses to glucagon in the glibenclamide-treated group (SU, n = 18), and the insulin-treated group (Insulin, n = 16), at baseline and at the end of the study. Data are mean ± SEM. § p = 0.009, # p = 0.006, + p < 0.001 for effects within groups vs. baseline.
