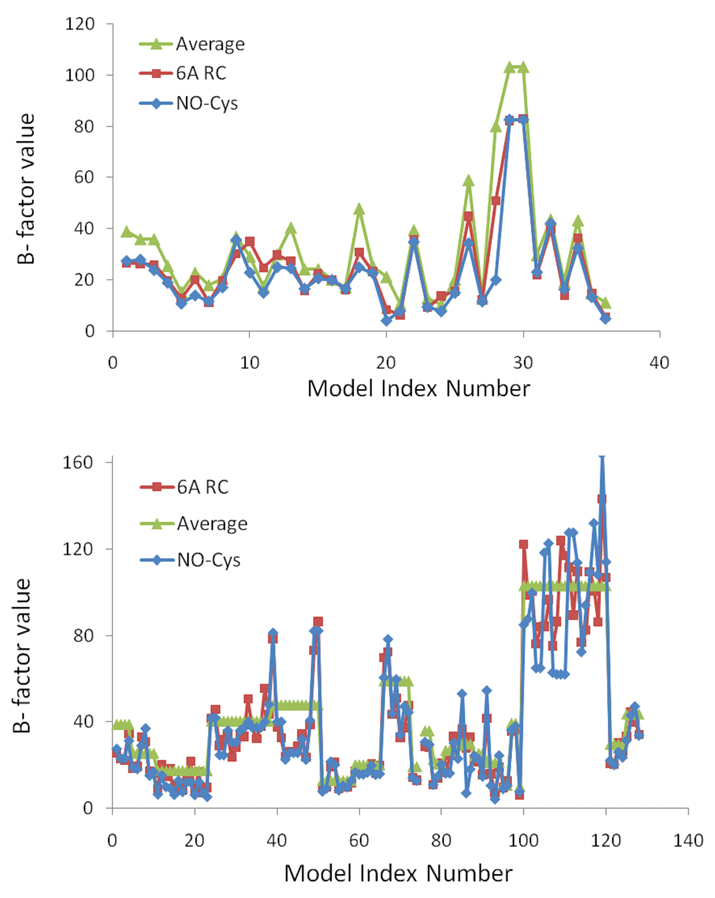
Figure 7. B factor analysis of NO-Cys sites.
The upper panel shows calculated B factor values of NO-Cys sites (i.e., dataset protein, Table S1), and the lower panel the B-factor values for all other Cys in the same proteins. NO-Cys alone is shown in blue, the average value for amino acids in proximity (within 6 Å, shown as 6A RC) to the Cys in red, and the average B factor value for the protein in green. On the X axis, Model Index Number refers to the NO-Cys ordered as in Table S1 (upper panel), or to all Cys of the same proteins ordered in the N-terminal to C-terminal direction: thus for each protein in Table S1, all Cys (excluding the NO-Cys itself) are listed in N-terminal to C-terminal order in the graph.

