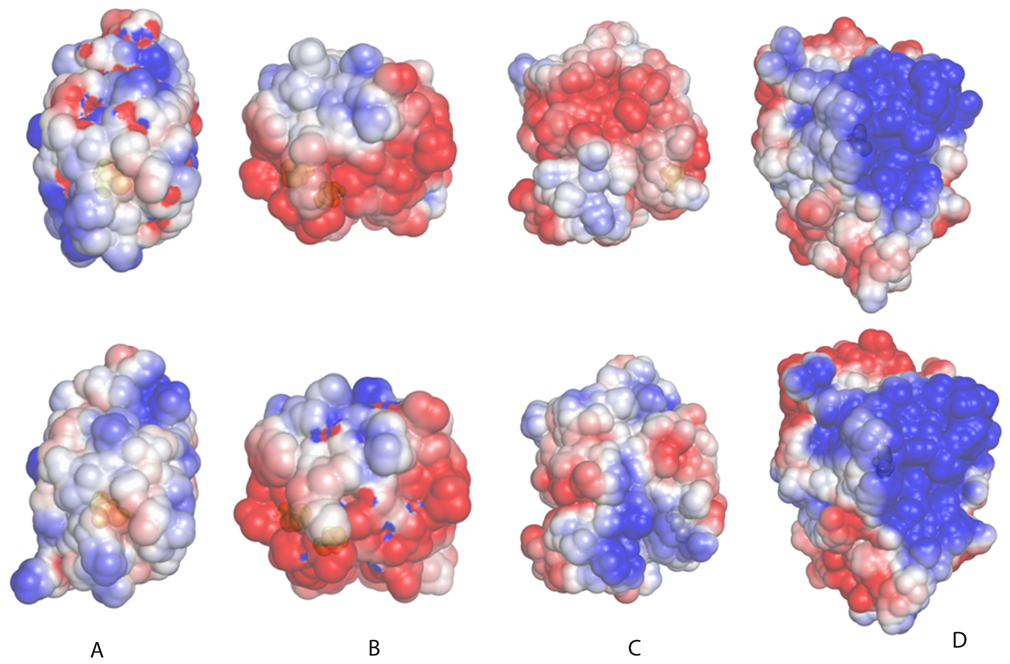
Figure 8. Effect of S-nitrosylation on electrostatic potential distribution.
Electrostatic potential distribution plotted on the solvent accessible surface is shown for four proteins, for which crystal structures are available for both S-nitrosylated and non-modified forms. In the upper row, non-modified proteins are shown, and in the lower row the corresponding structures with NO-Cys. A) Blackfin tuna myoglobin; B) human TRX1; C) human hemoglobin (chain B); D) human PTP1b. PDB codes for these proteins are (first number corresponds to NO-Cys-containing protein, and second to non-modified protein): myoglobin (2NRM and 1MYT), TRX1 (1ERU, 2HXK), hemoglobin (1BUW and 1A3N), and PTP1B (3EU0 and 2F6F). The potentials range from −2.5 kT per proton charge (red) to +2.5 kT per proton charge (blue). Proteins are oriented with the modified Cys (shown in space fill, colored in yellow, below the semi-transparent protein surface) oriented toward the reader.

