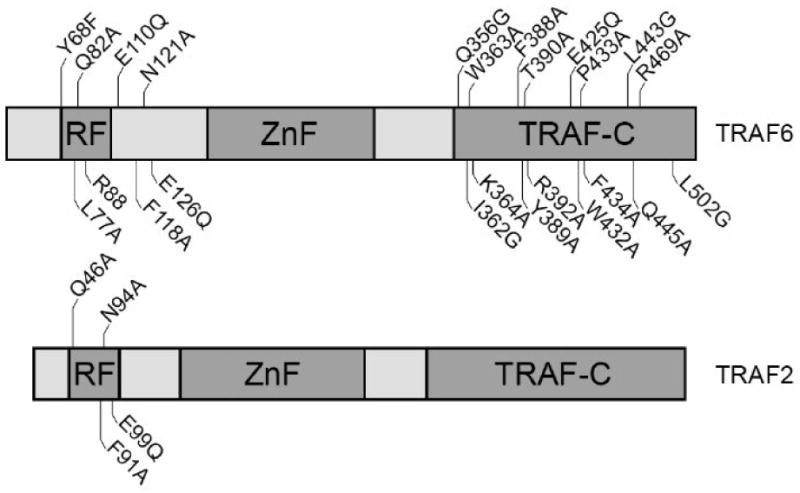
Fig. 1.

Schematic representation of the proteins TRAF6 and TRAF2. Previously defined domains are shown as darker rectangles. Vertical lines show the relative positions of the amino acid alterations that were introduced in both proteins. RF: RING finger, ZnF: Zinc fingers.
