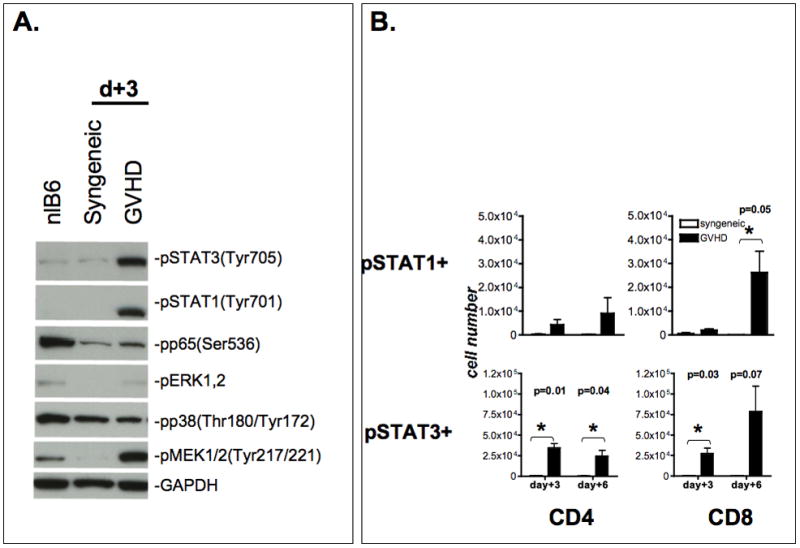
Figure 2. Inflammatory signaling pathways in splenic T cells.

A. Inflammatory signaling pathways in splenic T cells. Animals were sacrificed on day +3 post-BMT. Normal B6, syngeneic controls and GVHD animals were studied. Total spleen cells from 5–10 animals per group were pooled and magnetically enriched for T cells using negative selection resulting in a >90% purity. Lysates were prepared as described and immunoblotted with pSTAT1, pSTAT3, p-p65, p-MEK1,2, p-pERK1.2, p-p38 and GAPDH as housekeeping control. Data are representative of one out of two independent experiments.
B. Expansion of pSTAT1/3 positive CD4 and CD8 T cells. Splenocytes were harvested on day +3 and +6 post-BMT. Phosphorylation status of STAT1 (Tyr701) and STAT3 (Tyr705) in CD4+ and CD8+ T cells was assessed using phosphotyrosine-specific antibodies using flow cytometry. The mean number of p-STAT1 and p-STAT3 expressing cells (+/− SEM) is depicted for animals with GVHD and syngeneic controls (n= 3). Statistical significance was calculated using the student t-test. There was no significant different between syngeneic controls and untreated normal recipients (data not shown).
