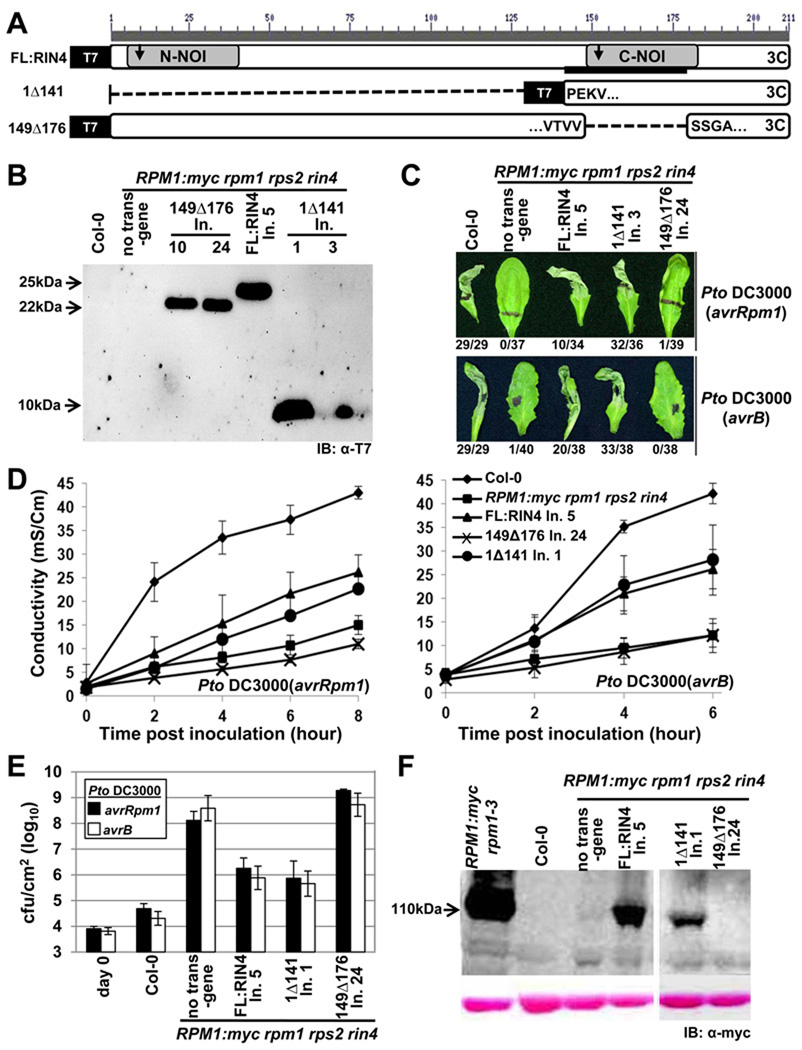
Figure 1. The C-terminal NOI of RIN4 is required for RPM1 function.
(A) Schematic diagram of RIN4 derivatives. Gray boxes are N- and C-terminal NOI domains, the black bar is the AvrB binding site (BBS), the arrows indicate the two AvrRpt2 cleavage sites, and the “3C” represents the C-terminal palmitoylation/prenylation site (Kim et al., 2005). Within the derivatives, the amino acids flanking the breakpoints are indicated. Each derivative has an N-terminal T7 epitope-tag.
(B) α-T7 immunoblot of microsomal membrane protein fractions from transgenic lines expressing the indicated RIN4 derivatives from (A) under control of the native RIN4 promoter in RPM1-myc rpm1 rps2 rin4 plants. The background pattern differs in the right hand panel because this is a higher percentage gel used to resolve 1Δ141 (9 kDa). Line numbers designate plant families homozygous for a single insertion locus that were derived from independent T-DNA insertion events.
(C) HR phenotypes of the indicated plants after infiltration with 5×10⁷ cfu/mL of Pto DC3000 expressing AvrRpm1 or AvrB, as noted at right. Representative leaves were photographed 20 hours after infiltration and the numbers below indicate the occurrence of macroscopic HR per number of tested leaves.
(D) Conductivity measurements after infiltration of the indicated plants with 5×10⁷ cfu/mL of Pto DC3000 expressing AvrRpm1 (left) or AvrB (right). Eight leaf discs that received the same infiltration were floated in a single tube and the conductivity of the solution was measured over time. Standard errors are from data combined from three separate experiments.
(E) Growth analysis 3 days after infiltration of 105 cfu/mL of Pto DC3000 expressing AvrRpm1 or AvrB into the indicated plants. The day 0 measurements show the number of bacteria in Col-0 plants immediately following infiltration. The results are from one of four representative experiments. Standard errors are from three separate experiments.
(F) RPM1 expression in microsomal fractions from the indicated lines. The strong signal in the line RPM1:myc rpm1–3 shows the high level of RPM1:myc accumulation in the presence of native RIN4.

