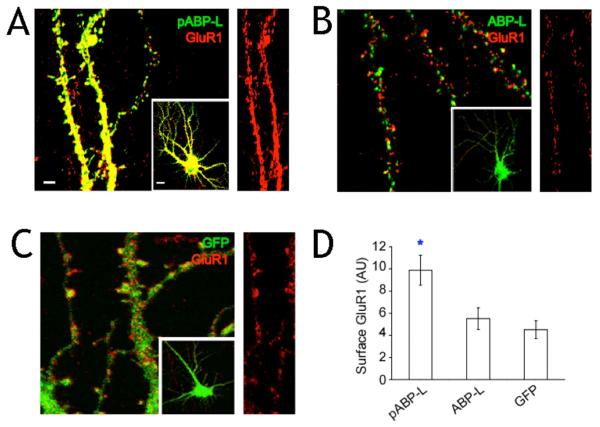
Fig. 4. Surface levels of endogenous GluR1increase in pABP-L expressing neurons.
Immunostaining of neurons infected with Sindbis virus expressing A, pABP-L B, ABP-L and C, GFP alone. 18-24 hours after infection, fixed (but not permeabilized) neurons were labeled with a polyclonal GluR1 N-terminal antibody to visualize endogenous surface GluR1. Magnified images of infected dendrites (scale bar = 3 μm) are shown from the infected cells in the inset (scale bar = 10 μm). Right hand panel of each image shows endogenous surface GluR1 staining in isolation for comparison. D, Quantitation of endogenous surface GluR1 staining in infected neurons (n = 20 cells; 3 experiments). Asterisk indicates significant difference from ABP-L and GFP (P<0.01). AU = arbitrary units.

