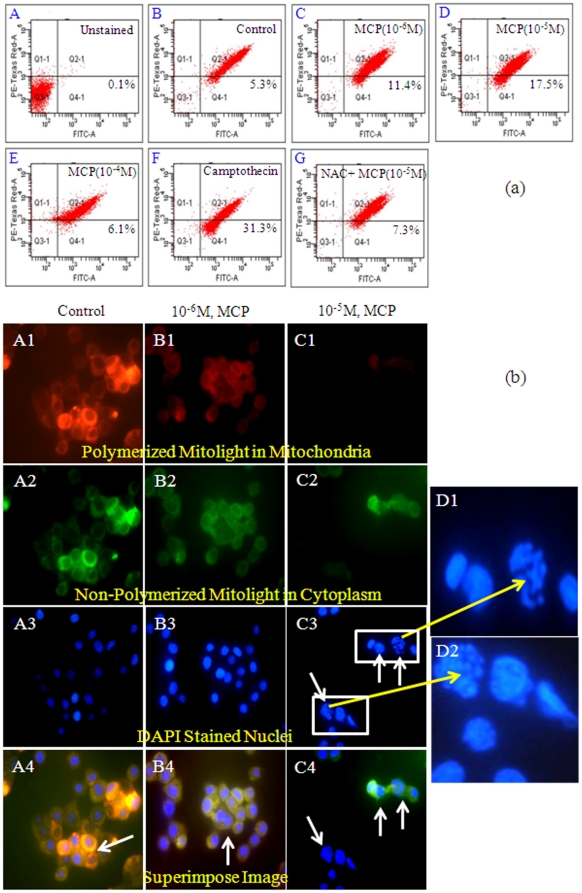
Figure 3. Apoptosis induction in PC12 cells exposed to MCP.
(a) Apoptosis detection in PC12 cells exposed to MCP using Mitolight™ apoptosis detection kit (catalog no. APT142, Chemicon, USA). (A) Unstained cells; (B) Control cells; (C) PC12 cells exposed to MCP (10−6 M) for 6 h; (D) PC12 cells exposed to MCP (10−5 M) for 6 h; (E) PC12 cells exposed to MCP (10−4 M) for 6 h; (F) Experimental positive control- PC12 cells exposed to campothecin (3 µg/ml) for 6 h; (G) Cells pretreated with 10 µM NAC for 1 h and then exposed with MCP(10−5 M) for 6 h. (b) Apoptosis detection by Mitolight™ apoptosis detection kit using Upright Phasecontrast Microscope (Nikon 80i, Japan) at 10×100x oil immersion magnification. The images were snapped by Nikon DS-Ri1 (12.7 megapixel) camera. Figure A1- Control cells showing intense red color due to polymerization of Mitolight dye in mitochondria indicative of healthy mitochondria. Figure A2- green color indicates the accumulation of non-polymerized dye in cytoplasm. Figure A3- Nuclei stained with DAPI.Figure A4- Superimposed microphotographs showing healthy mitochondria with intact membrane. Figure B1-B4: PC12 cells exposed to MCP (10−6 M) for 6 h shows significant dissipation in Mitochondrial membrane potential. Figure C1–C4: PC12 cells exposed to MCP (10−5 M) for 6 h. C-3: cells showing nuclear condensation and fragmentations (D1 and D2 are magnified view highlighting the same). C-4: Superimposed microphotograph showing apoptotic events.

