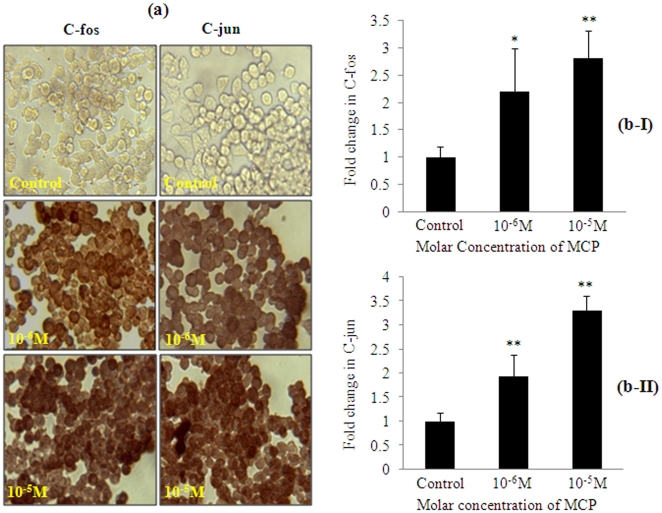
Figure 7. MCP induced alterations in the expression of early response genes.
(7a) Representative microphotographs of immunocytochemical localization of C-fos and C-jun proteins in PC12 cells exposed to MCP (10−5 and 10−6 M). Images were taken by Nikon Eclipse 80i equipped with Nikon DS-Ri1 12.7 megapixel camera, Japan. (7b I & II) Relative quantification of fold inductions in the expression of C-fos and C-jun proteins in PC12 cells exposed to MCP (10−5 and 10−6 M) for 6 h. Leica Q-Win 500 image analysis software was used to quantify the expression of C-fos and C-jun. Data were calculated as mean ± SE of at least 20 fields from three independent experiments.

