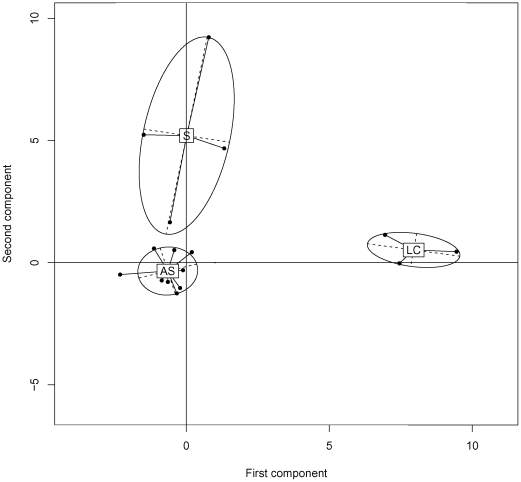
Figure 2. Discriminant analysis showing the relations between sand fly species and the three ecosystems.
Each dot represents one village. Villages were classified in the ecosystem (LG, S and SC) they belong to. Sand fly captures were used to compute the coordinates of the dots (dimensionless units). Confidence ellipses materialized the variability of capture data across ecosystems. The Ndiaye Bopp (NB) village was excluded from this analysis because it is the only village with an intermediate ecosystem between S and SC (see Figure 1).

