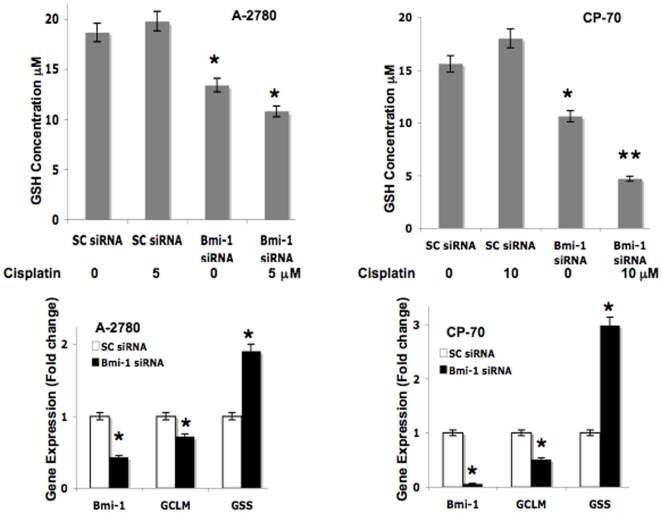
Figure 3. Bmi-1 knockdown perturbs the GSH biosynthesis pathway.
The top panel represents total cellular GSH measured (Materials and methods) in ovarian cancer cells transfected with scrambled control or Bmi-1 siRNA treated with or without cisplatin for 24 h. The bottom panel represents fold change in gene expression (normalized with beta actin and compared to scrambled control) as determined by quantitative RT-PCR of ovarian cancer cells transfected with scrambled control or Bmi-1 siRNA for 48 h.

