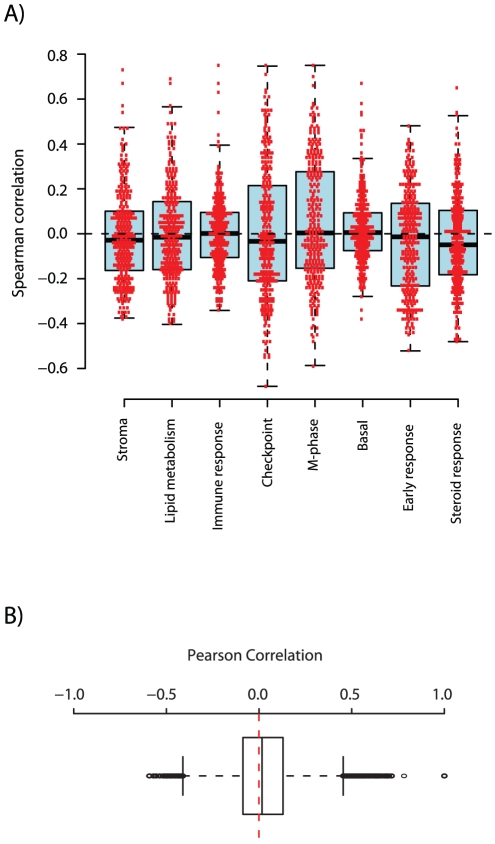
Figure 6. Correlation of genes in the CSR signature to different gene modules and pair wise co-expression.
(A) For each gene module and gene in the CSR centroid (n = 304 matching), a Spearman correlation value is computed by comparing the expression pattern across all samples for a specific gene to the corresponding rank sum for each sample in the specific module. Red dots indicate actual correlation values. (B) Box plot of pair wise correlations (n = 46056 pairs) of 304 genes from the CSR centroid matching in the 1751-sample set used by the CG application, showing that the absolute majority of genes in the CSR gene signature is not co-expressed across a large set of breast tumors.

