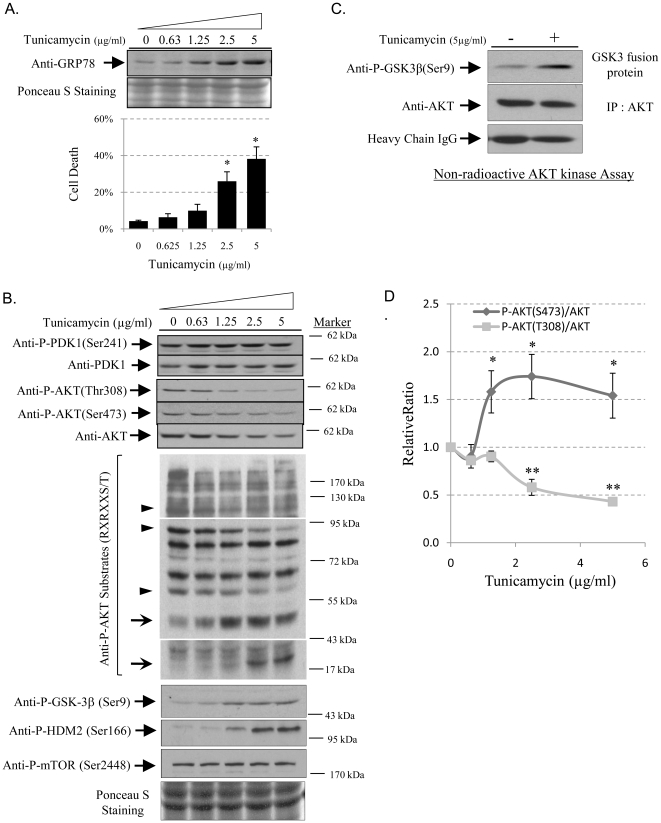
Figure 1. ER stress reduces AKT phosphorylation at Thr308, but increases it at Ser473, and alters target substrate specificity.
In a dose-response study of tunicamycin, JEG-3 cells were treated with increasing concentrations of tunicamycin (0, 0.625, 1.25, 25 and 5 µg/ml) for 24 hours. Proteins were isolated for Western blotting analysis for GRP78, AKT, P-AKT(Thr308), P-AKT(Ser473), P-PDK1(Ser241), P-AKT substrate (RXRXXS/T), P-mTOR(Ser2448), P-HDM2(Ser166), and P-GSK-3β(Ser9). Ponceau S staining was used to show equivalent input of cell lysate. Densitometry of band intensity is expressed relative to untreated control (100%). Phosphorylation status is presented as the ratio between phosphorylated and total protein. Data are mean±SEM from 3 to 5 independent experiments. ** and * indicate P<0.01 and P<0.05. A) Increasing severity of ER stress gradually induces GRP78 expression and cell death. B) ER stress suppresses AKT phosphorylation and modulates downstream substrates specificity without affecting PDK1 phosphorylation. Arrowheads and arrows indicate AKT substrate phosphorylation levels going down and going up respectively with increasing ER stress. Because of the different abundances of the AKT substrates, the blots of phospho-AKT substrates necessitated different exposure times. Here, three exposures are merged into a single image in order to view all potential bands. The blot shown is a typical result from 3 independent experiments. C) An in vitro non-radioactive AKT kinase assay using GSK-3β fusion protein as the substrate showed increased overall AKT activity in tunicamycin-treated cells. A similar result was obtained from a repeat experiment. D) Normalisation between phosphorylated AKT and AKT indicates an increase of Ser473 phosphorylation but a decrease at Thr308.

