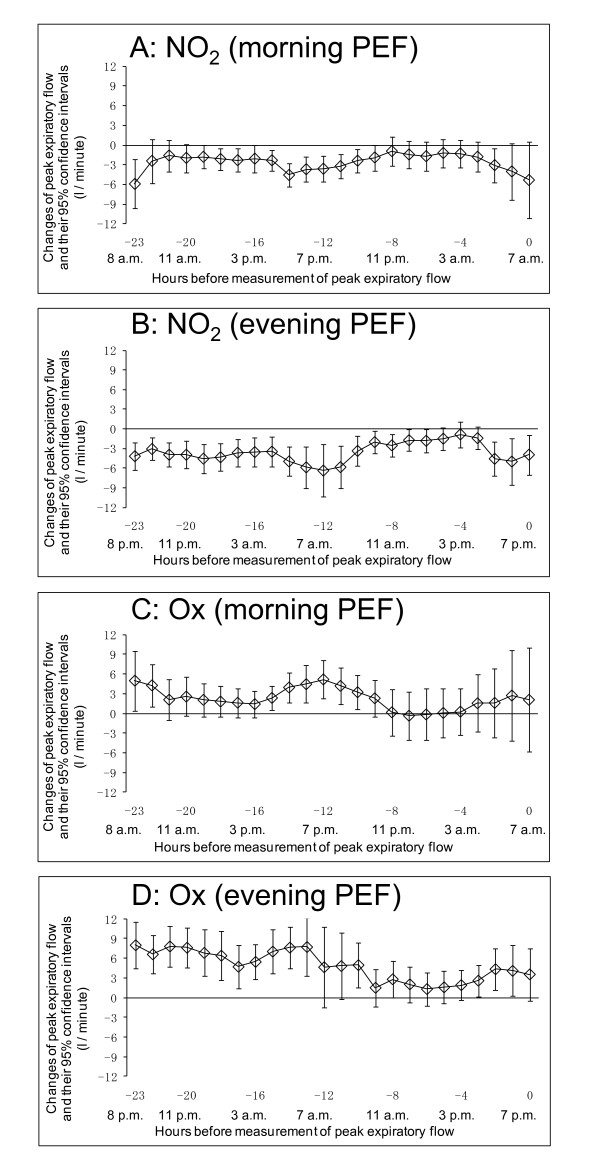
Figure 4.
Association between PEF and hourly concentration of other pollutants (NO2 and Ox) using single-pollutant model. Lagged-hour exposures of up to 24 hours were examined. Mean differences and 95% confidence intervals in PEF for 10 ppb increases in NO2/Ox were estimated using single pollutant model adjusted for age, sex, height, day of the week, temporal trends, and temperature. A: Association between PEF measured in the morning at 7 a.m. and hourly concentration of NO2. B: Association between PEF measured in the evening at 7 p.m. and hourly concentration of NO2. C: Association between PEF measured in the morning at 7 a.m. and hourly concentration of Ox. D: Association between PEF measured in the evening at 7 p.m. and hourly concentration of Ox

