
Figure 2.
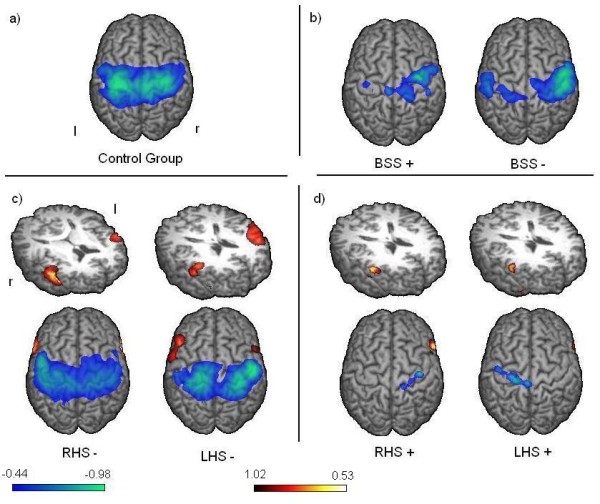
Event related desynchronization. Group results of changes in the beta-frequency-band during swallowing execution compared to the resting stage are shown. The color bar represents the t-value (yellow - red donates beta synchronization, green - blue the desynchronization). Significant activation in group analysis is shown (p < 0.05). a) In control subjects bilateral pericentral activation is seen. b) In both patient groups with brainstem stroke a right hemispheric lateralization of pericentral activation is observed. Stronger activation is seen in the non dysphagic group. c) In non dysphagic patients with hemispheric stroke pericentral activation is lateralized to the unaffected hemisphere. Additionally prefrontal synchronization with lateralization to the affected side is observable. d) In dysphagic hemispheric stroke patients very little pericentral activation of the affected hemisphere is found, while no contralesional activation is present. Prefrontal activation is only significant in the right hemisphere.