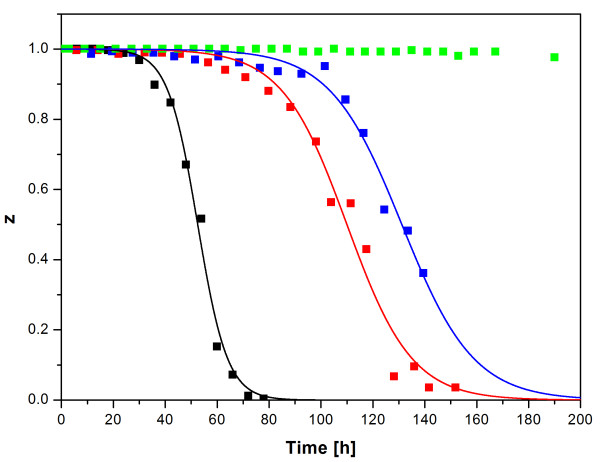
Figure 2.
Plasmid-harbouring cell fraction z as a function of cultivation time. Experimental results were processed and simulations were carried out employing Eq. 23 and using the software product Berkeley Madonna, Version 8.3.9. (black squares and line - pP1-(SD)-hIFNγ; red squares and line - pP1-(4SD)-hIFNγ; blue squares and line - pP1-(ΔSD)-hIFNγ; green squares - pΔP1-(ΔSD)-hIFNγ. Data points and lines represent experimental results and trajectories predicted by the model calculations, respectively.)

