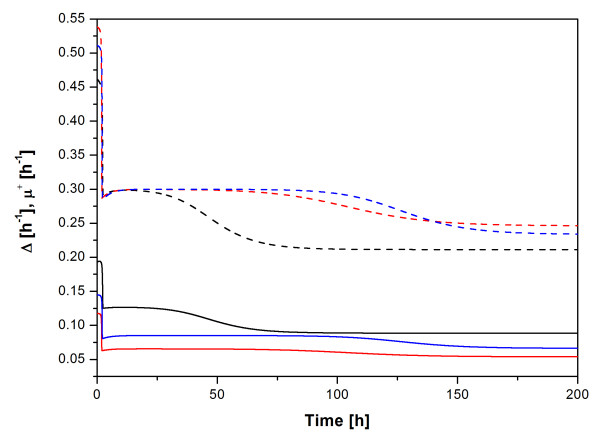
Figure 4.
Simulated specific growth rate difference and specific growth rate of plasmid-harbouring cells. Specific growth rate difference Δ (solid lines) and specific growth rate of plasmid-harbouring cells μ+ (dashed lines) as a function of cultivation time predicted by the model of Lee et al. for the plasmids pP1-(SD)-hIFNγ (black lines), pP1-(4SD)-hIFNγ (red lines) and pP1-(ΔSD)-hIFNγ (blue lines).

