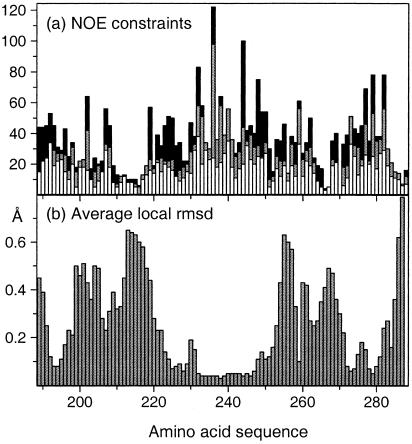
Figure 3.
(a) Number of NOE upper distance limits per residue in the amino acid sequence of CRT(189–288). The intraresidual and sequential upper distance limits are displayed as white bars, medium-range constraints are gray, and long-range constraints are black. (b) Average local backbone rmsd in CRT(189–288). The rmsd values plotted at the position of residue i were calculated for the N, Cα, and C′ atoms of the tripeptide segments of residues i − 1, i, and i + 1.

