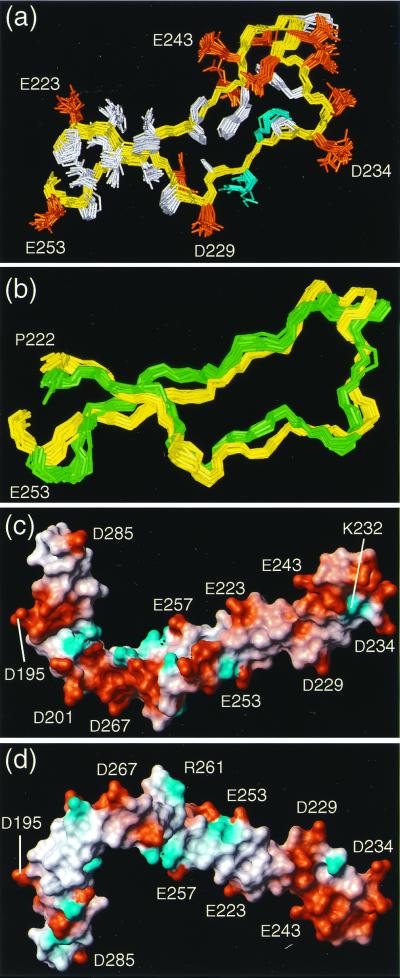
Figure 5.
(a) Superposition for best fit of the backbone atoms N, Cα, and C′ of the residues 223–253 in CRT(189–288). The backbone is yellow. The side chains are blue for positively charged residues, red for negatively charged residues, and white for hydrophobic and polar residues. The positions of selected residues are indicated. (b) Superposition for best fit for the residues 222–253 of the mean structures of CRT(189–288) (yellow) and CRT(189–261) (green) (rmsd = 1.98 Å). For each of the two structures a set of 20 conformers is shown, which have been fitted individually to the respective mean coordinates. (c and d) Surface views of CRT(189–288). Red indicates negative electrostatic charges and blue, positive electrostatic charges. The positions of selected residues are indicated. The orientation of the molecule in c corresponds to that in Fig. 2c, and the orientation in d was obtained by a 180° rotation about a horizontal axis.

