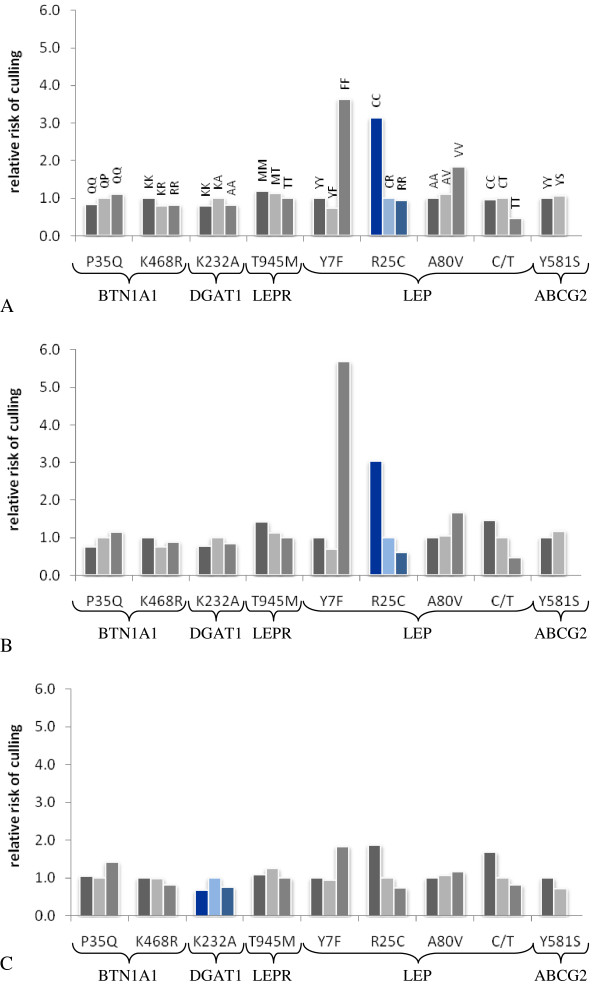
Figure 1.
Relative risk of culling for different genotypes estimated based on model M20. Polymorphisms with the lowest FDR based on the comparison of M20 with (M11-M19) are marked in blue. A. Weibull model for functional longevity. B. Cox model for functional longevity. C Weibull model for true longevity.

