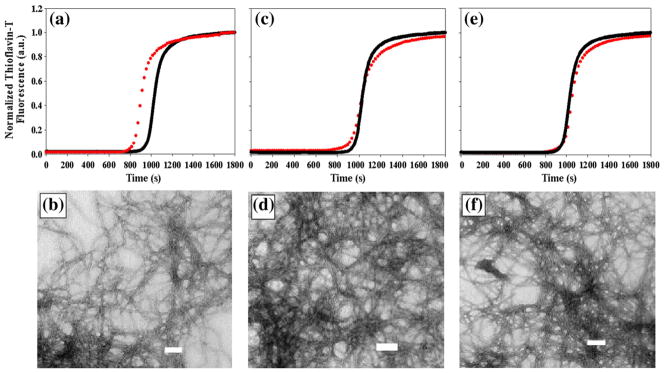
Fig. 2.
Thioflavin T monitored kinetics of the FC≡N variants of IAPP compared to wild type, together with TEM images of the FC≡N variants collected at the end of the reaction. Red curves are FC≡N variants and the black curve is wild-type IAPP. (a and b) IAPP F15FC≡N, (c and d) IAPP F23FC≡N, (e and f) IAPP Y37FC≡N. The scale bar in the TEM images represents 100 nm. Final conditions were 32 μM peptide, 2% HFIP, and 20 mM Tris–HCl at pH 7.4 and 25 °C.

