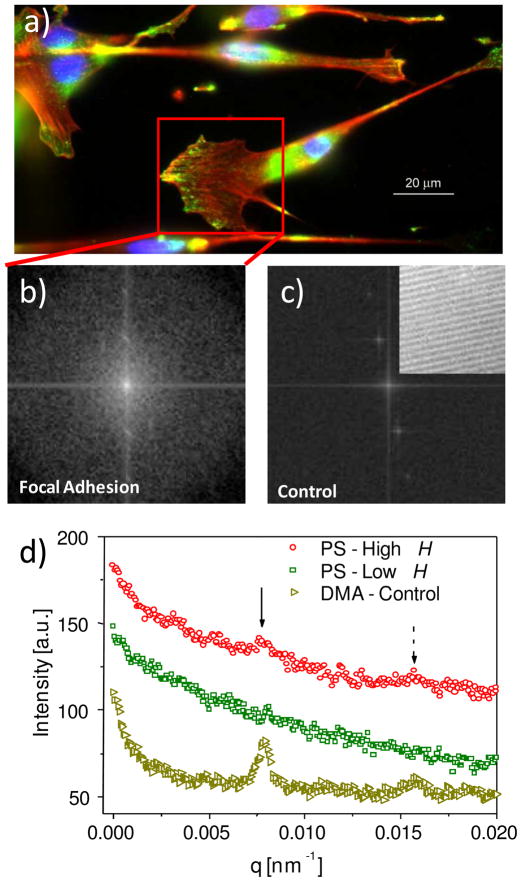
Figure 4.
(a) Fluorescent images of focal adhesion complexes for cells on PS grating (H ≈ 300 nm). The nuclei are in blue, the actin is in red, and the focal adhesion is in green. A box is drawn to enclose a region with a high concentration of focal adhesion complexes. The green channel in the box was subsequently analyzed via FFT. (b) Image generated by FFT of the boxed region. (c) Image by FFT of a control grating at high H without cells (DMA, real space image provided as inset). (d) Intensity versus q plot for focal adhesion complexes on PS gratings at high and low H, and on the control gratings without cells. Solid and dashed arrows correspond to the first and second order diffraction peaks, respectively.

