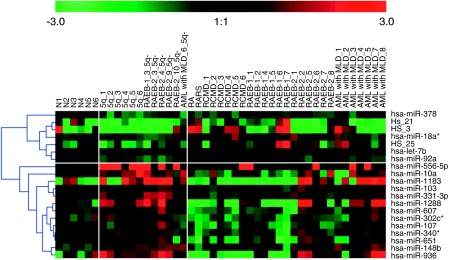
Figure 3.
Differentially expressed miRNAs in patients with and without deletion at the 5q32 region. The binary logarithm of relative miRNA expression changes is expressed by a color gradient intensity scale, as shown at the top. Green color indicates downregulation, red color indicates upregulation of miRNA expression. Each column represents a separate sample and each row a single miRNA. N, control samples; miR*, complementary miRNA variants.

