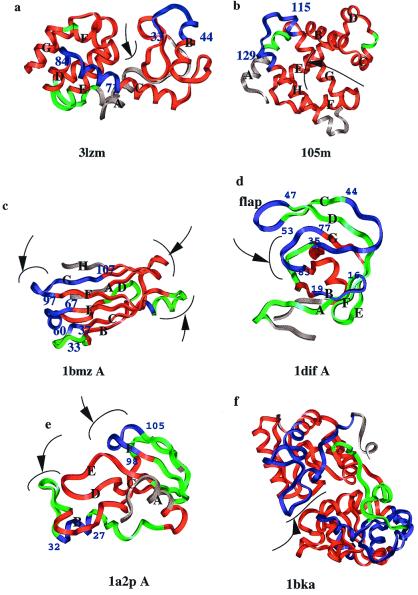
Figure 3.
The color assignments showing the more and less deviated regions. (a) T4 lysozyme (3lzm); (b) myoglobin (105 m); (c) transthyretin (1bmz A); (d) HIV proteinase (1dif); (e) barnase (1a2p A); (f) lactoferrin (1bka). The regions most prone to respond to mutations are shown in blue and the least prone, in red. The regions between blue and red are in green. Few residues at the N and C termini in each case are in gray, so the flexible termini do not affect the coloring scale. The α-helices and β-strands are labeled for clarity. The binding or active sites are indicated by arrows. The cutoffs for blue, green, and red regions differ in the different cases and are as follows (in Å): (a) 3lzm: under 0.30 red, over 0.35 blue; (b) 105m: under 0.75 red, over 2.00 blue; (c) 1bmz: under 0.40 red, over 0.50 blue; (d) 1dif A: under 0.40 red, over 0.60 blue; (e) 1a2p A: under 0.60 red, over 0.80 blue; (f) 1bka: under 0.75 red, over 1.00 blue. Between red and blue, the regions are colored green. Cutoffs are based on visual observation rather than setting of a standard value, because the extent of the deviation and the regions lengths vary from case to case. The residue positions of the blue regions are marked. The pictures were generated by using molecular graphics package INSIGHT II (Molecular Simulations).

