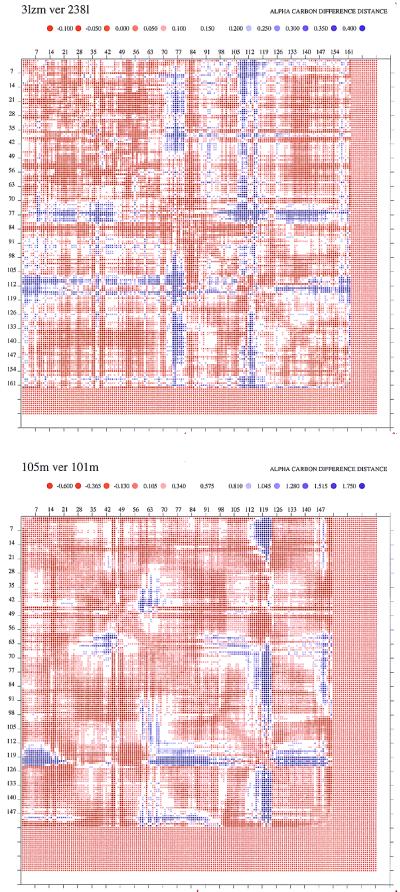
Figure 5.

Distance difference matrices plots for two mutants, one of lysozyme (a) 3lzm-238l, and the second (b) for myoglobin 105m-101m. The program ddmp (18) was used to generate the plots (http://www.csb.yale.edu). Additional plots are presented in the supplemental data (see Fig. 8 for lysozymes and Fig. 9 for myoglobin). The default parameters and color scale have been used. The colored dots represent distance differences between the two proteins, according to the scale shown. The advantage of this program is that it presents contour plots of all inter-Cα distances. The distances of the mutants are subtracted from those of the wild type.
