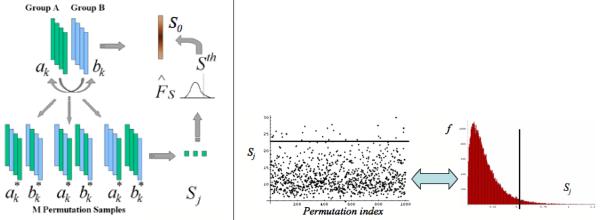
Figure 6.
Left: Scheme of P-value computation via permutation tests. The real group difference S0 (e.g. Hotelling T2) is compared to that the group differences Sj of random permutations of the group labels. The quantile in the Sj histogram associated with S0 is the p-value. Right: Example run on test data with 1000 random permutations. On the left the individual Sj are plotted and on the left the corresponding Sj histogram is shown. The black line indicates the value of S0.

