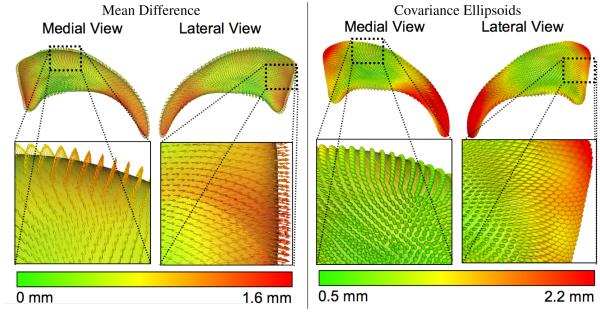
Figure 9.
Descriptive statistics of right caudate analysis. The left visualization shows the mean difference as a colormap from green (0 mm difference) to red (1.6 mm difference) as well an vectorfield on the overall mean surface mesh. For two regions with large differences a zoomed view is provided. The right visualization shows the covariance ellipsoid colored with the magnitude of the largest ellipsoid axis (axis of largest covariance). The same two zoomed views are provided. The variance in the first zoom section is markedly reduced compared to the second zoom section.

