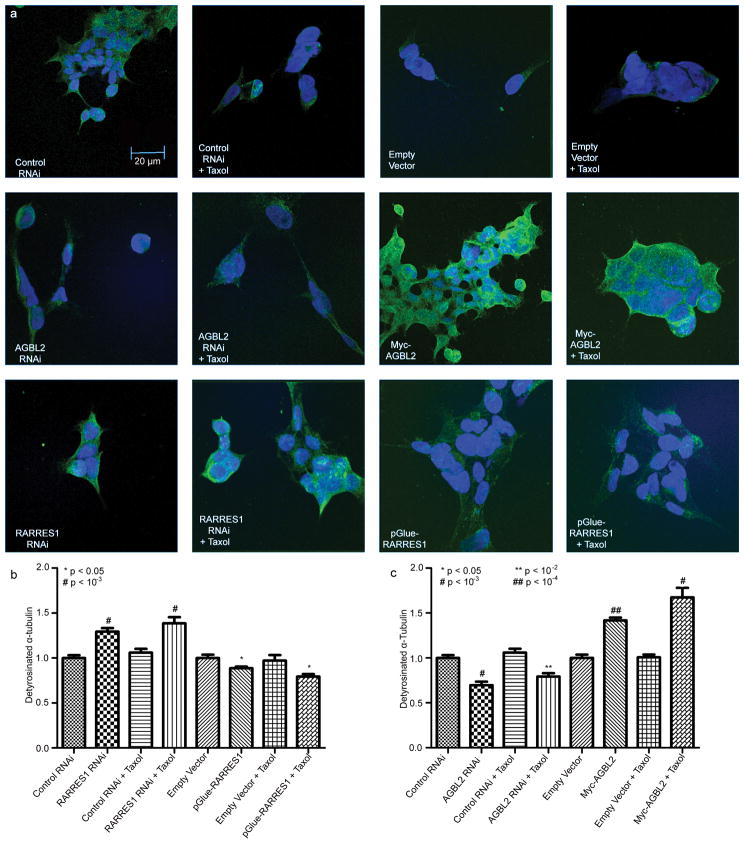
Figure 5. RARRES1 and AGBL2 regulate the detyrosination cycle of α-tubulin in HEK 293 cells.
(a) Immunofluorescence signal of Alexa 488 probing the detyrosinated α-tubulin (Green) and DAPI probing the nucleus (Blue) in HEK 293 controls, RARRES1 knockdown, AGBL2 knockdown, RARRES 1 overexpression, AGBL2 overexpression with and without taxol treatment. The color balance and the contrast of all the images combined were optimized using Photoshop cs3 to allow for visualization of both DAPI and detyrosinated tubulin staining on an 8-bit resolution monitor. An example of the original image used for quantitation is included in the supplementary materials (Figure S1); (b) Average signal intensities of detyrosinated α-tubulin in HEK 293 cells following knockdown or exogenous expression of RARRES1 with and without taxol treatment; (c) Average signal intensities of detyrosinated α-tubulin in HEK 293 cells following knockdown or exogenous expression of AGBL2 with and without taxol treatment.

