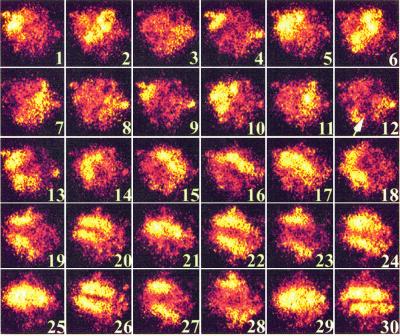
Figure 3.
Asymmetric addition of FMLP correlates with perturbation and reorientation of metabolic patterns. Images were acquired for 10 ms with 100 ms between each frame. A time sequence of 30 NAD(P)H images of a PMA-primed neutrophil are shown. The cell's leading edge is oriented toward the lower right-hand corner of each frame; the uropod is near the upper left-hand corner. FMLP was applied to cells from a direction perpendicular to the direction of cell polarization (arrow in frame 12). Frames 1–11 show a unidirectional traveling wave. Frames 12–15 show a major perturbation in NAD(P)H fluorescence. By frame 22, the metabolism has become reorganized into two waves. (×1,120)

