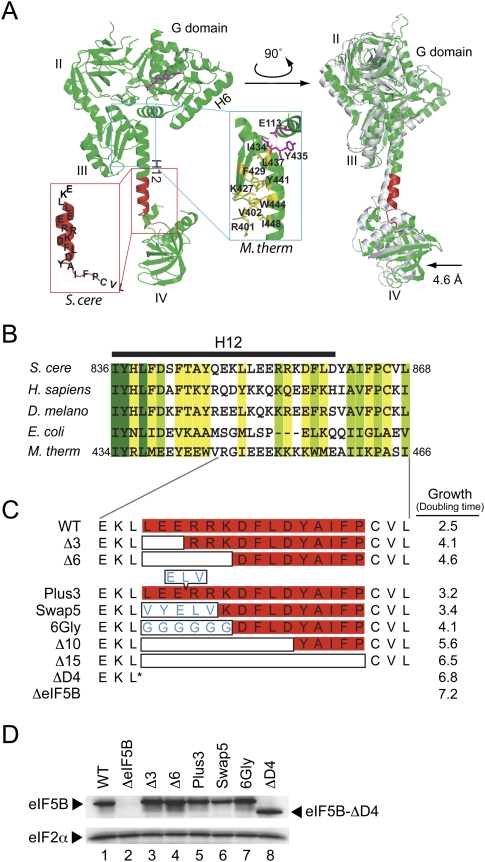
FIGURE 1.
Mutational analysis of helix H12 in yeast eIF5B. (A) Ribbon representation of X-ray crystal structure of aIF5B (M. thermoautotrophicum) in complex with GTP (Protein Data Bank [PDB] code 1G7T) (Roll-Mecak et al. 2000). The four domains of the protein (G, II, III, and IV) and helices (H6 and H12) are labeled. The structure on the right is rotated about the vertical axis to better visualize the lever-type domain IV movement in the presence of GTP (colored) versus GDP (gray; PDB code 1G7S). The inset in the blue box highlights the interactions between top of H12 and the G domain and domain III in aIF5B (labels refer to M. thermoautotrophicum residues). The inset in the red box depicts the corresponding H12 region in yeast (S. cerevisiae) eIF5B that was subjected to mutational analysis. (B) Sequence alignments of helix H12 region of eukaryotic, bacterial, and archaeal eIF5B/IF2. Identical residues within the aligned sequences are shown in dark green, conserved residues are shown in yellow green, and weakly conserved residues (conserved in three out of five residues sequences) are in yellow. Residue numbers are shown for S. cerevisiae and M. thermoautotrophicum, and the position of helix H12 is denoted by the black bar above the sequences. (C) Schematic representation of helix H12 mutants. Open boxes indicate deleted residues, whereas amino acid residues within the boxes indicate insertions (Plus3) or substitutions (Swap5 and 6Gly). Doubling times in SD medium of yeast strain J111 expressing the indicated H12 mutant are shown on the right. (D) Western blot analysis of eIF5B expression. Whole cell extracts prepared from yeast transformants in panel C were subjected to immunoblot analysis using anti-eIF5B or anti-eIF2α antiserum as previously described (Choi et al. 2000).

