FIGURE 4.
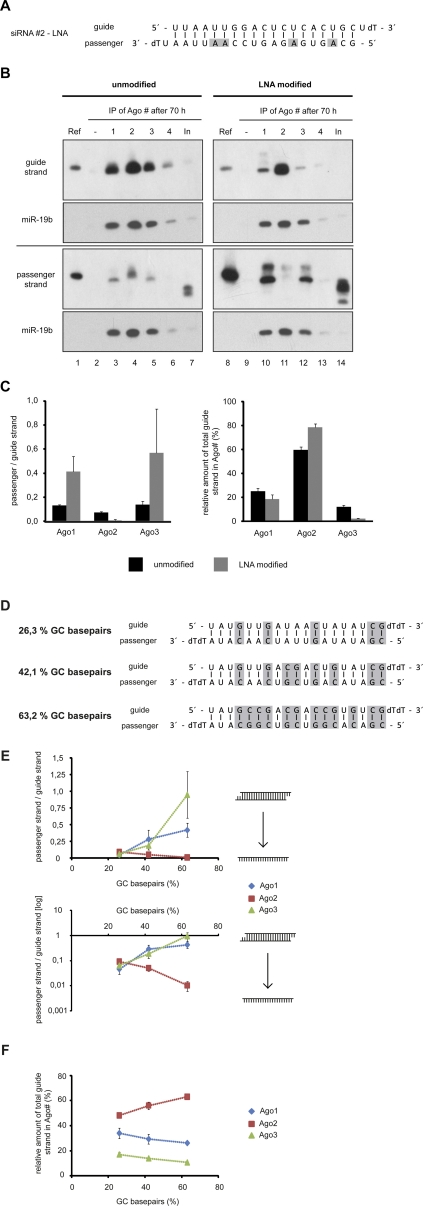
Thermodynamically stabilized siRNA duplex lead to reduced passenger strand displacement efficiency of noncatalytic Ago proteins. (A) LNA-modified siRNA#2 used for the following experiments. LNA-modified nucleotides are highlighted in gray. (B) Seventy hours after transfection with siRNA#2 or LNA-modified siRNA#2, cells were lysed and Ago1–4 (lanes 3–6,10–13) were immunoprecipitated from the lysates. RNA was isolated and analyzed by Northern blotting. Blots were stripped and reprobed for miR-19b. Ref indicates 3 pmol of the respective siRNA single strand; In, 2% of the input sample. (C) For the left graph, Northern blot signals from four independent experiments as the example shown in B were quantified, and the ratio of passenger strand to guide strand normalized by the reference signals (Ref in B) was plotted for Ago1–3. The right graph shows the relative distribution (percentage) of guide strand to Ago1–3 from the same set of experiments. Black bars indicate siRNA#2; gray bars, the LNA-modified siRNA#2. Error bars, SDs of the signals. (D) Three siRNAs with a similar sequence backbone but increasing GC content used for the following experiments. GC base pairs are indicated in gray. (E) siRNAs as shown in D were transfected into HEK 293T cells; cells were lysed 24 h later and Ago1–3 immunoprecipitated, and the amount of coimmunoprecipitated siRNA passenger and guide strands was quantified via Northern blots (data not shown). The ratio of passenger to guide strand of the siRNAs from three independent experiments is plotted as a function of the GC content on a linear scale (upper graph) and on a logarithmic scale (basis 10; lower graph). (F) The graph shows the relative distribution (percentage) of siRNA guide strand as a function of the siRNA GC content for the experiments described in E. Error bars in E and F, SDs.

