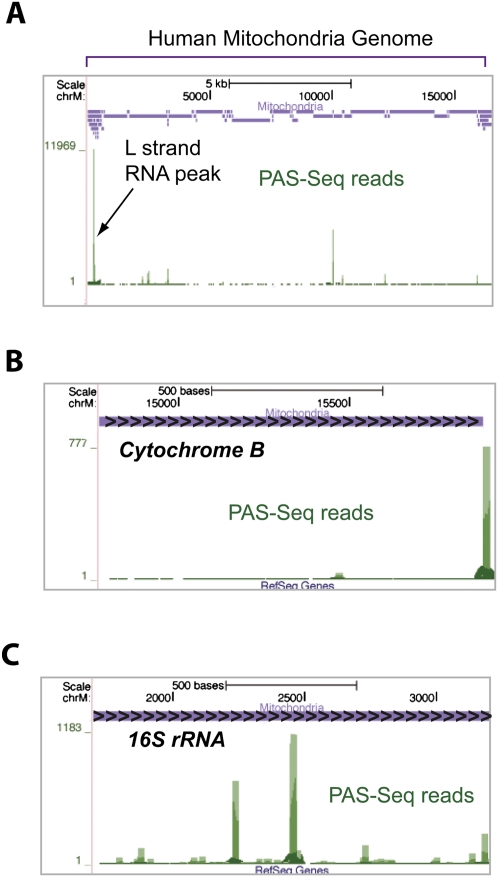
FIGURE 4.
A human mitochondria RNA polyadenylation map. (A) PAS-Seq mapping results on the entire mitochondrial genome. A custom track (purple) shows the positions of all human mitochondrial genes. The green bars represent PAS-Seq reads and the peak corresponding to the polyadenylated L strand transcripts is marked. (B) PAS-Seq mapping results on the cytochrome B gene. Overlapping PAS-Seq reads appear as a continuous line covering the majority of the gene. (C) PAS-Seq mapping results on the 16S rRNA gene.

