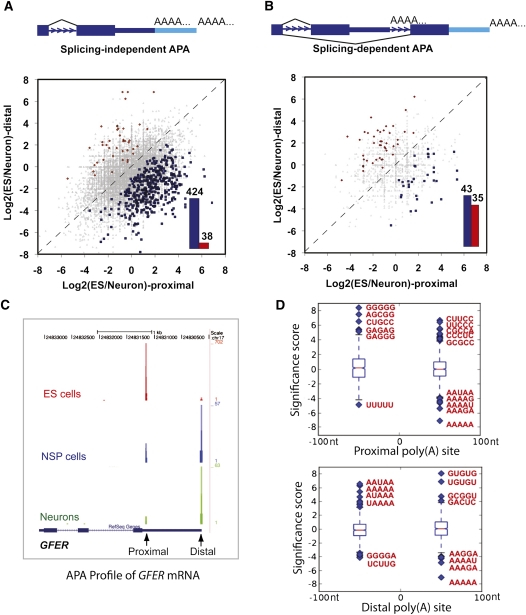
FIGURE 5.
Dynamic APA landscape during stem cell differentiation. (A) Splicing-independent APA changes between ES and neurons. Y-axis: ratio of PAS-Seq reads counts between ES and neurons for the distal poly(A) sites in log2 scale. X-axis: ratio of PAS-Seq reads counts between ES and neurons for the proximal poly(A) sites in log2 scale. APA events with statistically significant change (P < 0.05 by Fisher Exact Test) are colored in red (distal sites preferentially used in ES) or blue (proximal sites preferentially used in ES). Bar graph shows the number of red or blue data points in the scatter plot. (B) Splicing-dependent APA changes between ES and neurons. (C) PAS-Seq reads mapping results for the GFER gene in ES, NSP, and neurons. Proximal and distal sites are marked. (D) Box plots showing over- and underrepresented motifs at the regulated proximal and distal poly(A) sites. The sequences of the most over- and underrepresented motifs (Z score >5) are shown in red.

