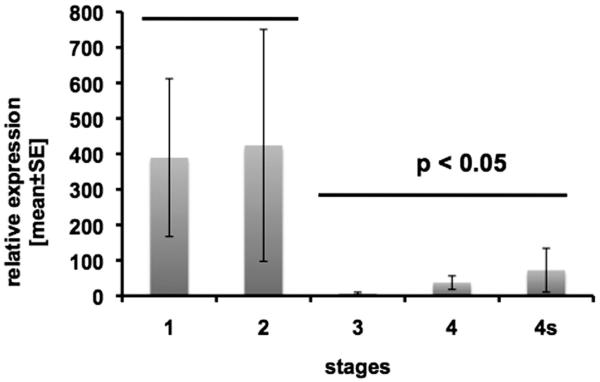
Figure 4.
Expression of sVEGFR-2 in 49 neuroblastoma (NB) tissue samples, as determined by real-time RT-PCR. The expression levels (bars, and standard error of the mean) are shown separately for each tumor stage. Tumor stages 3, 4 and 4s (progressed NB) demonstrate statistically (p < 0.05) significantly lower levels of sVEGFR-2 compared to localized stages 1 and 2. Primers used for RT-PCR were: sVEGFR-2 fwd: 5′- GCCTTGCTCAAGACAGGAAG -3′; sVEGFR-2 rev: 5′- CAACTGCCTCTGCACAATGA -3′. β-Actin fwd: 5′- GCATCCCCCAAAGTTCACAA -3′; β-Actin rev: 5′- AGGACTGGGCCATTCTCCTT -3′.

