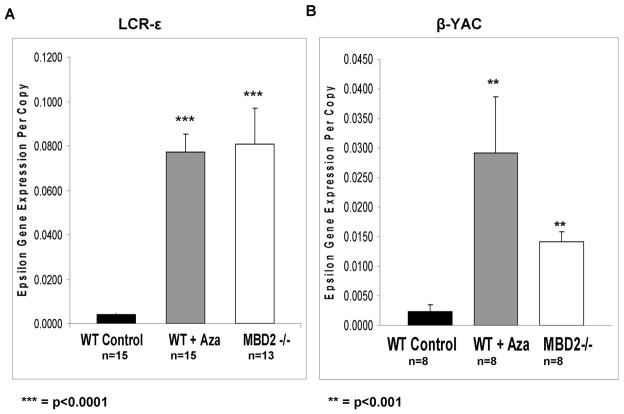
Figure 2. Expression of the human ε-globin gene in LCRε and β-YAC transgenic mice.
(A) LCR-ε transgenic mice. Shaded bars represent expression of ε-globin RNA in adult erythroid cells from adult transgenic LCR ε mice wild type controls, wild type treated with 5-azacytidine, or mice homozygous for knockout of MBD2(MBD2−/−) as indicated. Expression was normalized to mouse glycophorin A RNA levels and gene copy number in each experiment. (B) β-YAC transgenic mice. The expression levels shown from β-YAC mice were normalized to mouse glycophorin A RNA levels and gene copy number with the treatment and genotype indicated below each bar. The MBD2 −/− expression data show a 5 fold higher level of human ε-globin expression in LCRε transgenic mice relative to β-YAC transgenic mice (p<0.01). The number of independent erythroid samples assayed and p values determined by student’s t-test are shown in each panel.

