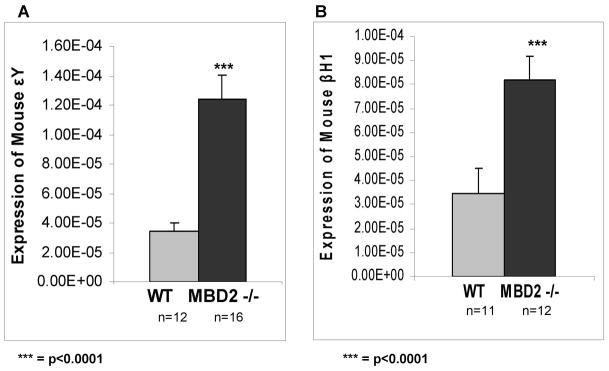
Figure 3. Expression of endogenous mouse embryonic βH1 and εY genes in wild type and MBD2 knockout adult mice.
Light shaded bars show expression levels relative to mouse glycophorin A in wild type adult red cells and dark solid bars show corresponding levels in red cells from adult MBD2 knockout mice. All relative levels were normalized to endogenous glycophorin A gene expression. The number of mice assayed in each experimental group is indicated below each bar.

