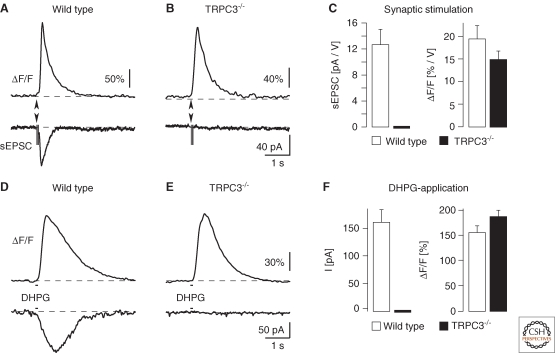
Figure 4.
Analysis of TRPC3-deficient mice (Hartmann et al. 2008). (A) Slow EPSC in a wild-type mouse (lower trace) and the corresponding local dendritic Ca2+ response (upper trace). (B) Similar recording in a TRPC3−/− mouse. (C) Summary graphs for normalized (to stimulation strength) slow EPSCs and Ca2+ transients. (D) DHPG evoked a slow inward current (lower trace) and a local Ca2+ transient (upper trace) in a wild-type mouse. (E) Similar recording in a TRPC3−/− mouse. (F) Summary of DHPG-evoked current (right) and Ca2+ (left) responses.

